来源:环球教育
小编:长安 85很多同学在写data题的时候很纠结数据的取舍问题,不舍得省去任何一个数字。以下环球教育孙蒙老师给出的这篇考官范文我们可以学习的是静态图处理多组很多数据的方法。
这个图一共给了7组age group,如果一组一组去写的话非常的繁琐像流水账,雅思小作文难道就是考记流水账??写完自己都向问自己写的是神马东西?_?!


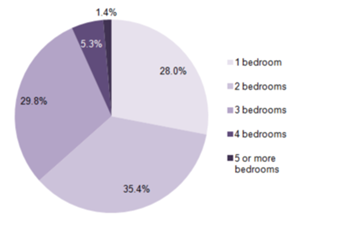
The bar chart shows the proportions of English men and women of different ages who were living alone in 2011. The pie chart compares the numbers of bedrooms in these one-person households.
The two charts give information about single-occupant households in England in the year 2011. The bar chart compares figures for occupants' age and gender, and the pie chart shows data about the number of bedrooms in these homes.
9分范文(main body 1)如下:
A significant majority of the people aged 65 or over who were living alone in England in 2011 were female. Women made up around 72% of single occupants aged 75 to 84, and 76% of those aged 85 or over. By contrast, among younger adults the figures for males were higher. For example, in the 35-49 age category, men accounted for nearly 65% of people living alone.
那考官是怎么处理的呢?挑出main features!男性比女性多最多的读一个数字(65%);女性比男性多最多的数字读出来(72%&76%),然后其他数据统统不重要!可以不写了。所以data题不能沉迷于报数据,小作文不是比谁的数据报告的多报告的细,而是看你能不能从一堆数字中找出最重要的信息,这才是雅思考察data题的目的。
9分范文(main body 2)如下:
In the same year, 35.4% of one-person households in England had two bedrooms, while one-bedroom and three-bedroom homes accounted for 28% and 29.8% of the total. Under 7% of single-occupant homes had four or more bedrooms.
后面这个图的描述对象实在有点奇葩了,讲的是"单人家庭拥有的卧室数量"。。。所以同学们以后再雅思考试遇到什么描述对象都要冷静,考雅思一切皆有可能啊。较小的数值可以省略,或者像这篇文章一样选择合并起来报告。
另外,这个独居家庭,我们可以学会的表达有,one-person households和single-occupant homes都是非常地道的表达,也可以用在大作文和口语当中。
Overall, females made up a higher proportion of people living alone than males, and this difference is particularly noticeable in the older age categories. We can also see that the most common number of bedrooms in a single-occupant home was two.
静态图不同于动态图,你会经常在静态图中看到总数,这个时候可以把总数写成overview,图一既:females made up a higher proportion of people living alone than males。